")
")


Kenya's mobile market has continued to grow as demand for ICT services rose in 2020 due to the COVID-19 pandemic. In this article below, we will showcase the latest stats related to the Kenyan telecom market, based on the report from the Communications Authority of Kenya which provides an overview of the performance and trends in ICT sector for September 2020 to December 2020.
The number of active mobile subscriptions as 31 December 2020 stood at 61.4 million, representing an increase of 2.6% from the preceding quarter. Subsequently, mobile (SIM) penetration grew by 3.3% points to stand at 129.1% during the period under review. During the same period, the data for Jamii Telecommunications Limited – a privately owned Kenyan telecommunication service provider offering broadband and mobile services under the "FAIBA" brand – is included in cellular mobile services sub-section which main services are delivering mobile data through 4G but also include Voice over LTE (VoLTE).
Figure 1 below illustrates the trends in mobile subscriptions and penetration levels.
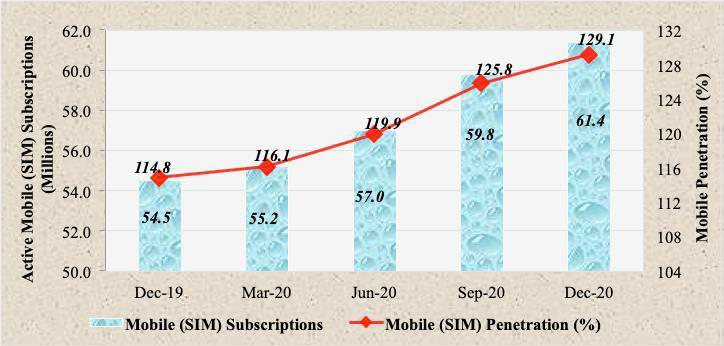
Source: CA, Operators’ Returns
Figure 2 illustrates the trends in the market shares in mobile subscriptions by operator over the period from September 2020 to December 2020. It is noteworthy that no increase was recorded. Market leader Safaricom lost a tiny bit of market share, with mobile subscriptions dropping by 0.1% in the quarter to a market share of 63.6%. Airtel maintained its position with 27.2% while Telkom Kenya and Equitel both lost 0.1% to post respectively 6.2% and 2.7% market shares.
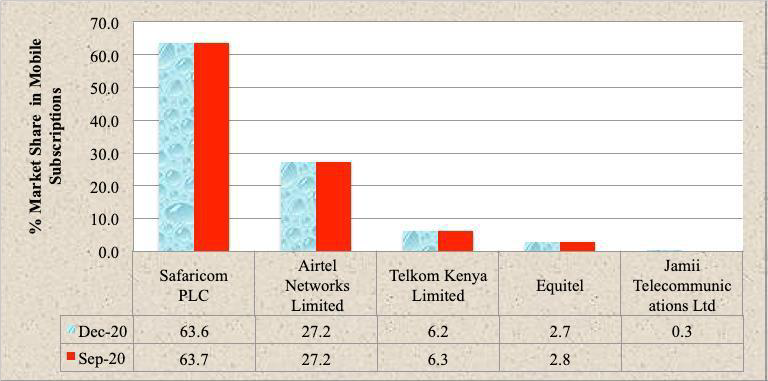
Source: CA, Operators’ Returns
Data and voice growth
During the quarter under review, the total local mobile voice traffic grew by 8.2% to 19.7 billion minutes. The increase is mainly attributed to Safaricom@20 Promotion that aimed at availing new subscribers with attractive voice and data bundle offers, while offering similar incentives to their existing customers. The offer ran from 23 October 2020 to 20 January 2021. Customers enjoyed once a day 20 voice minutes and 20 Mbs for 20 Kshs as well as got the first call of the day for free with a FUP (Fair Usage Policy) of 20 minutes.
The volume of on-net mobile voice traffic rose by 8.6% to post 17.3 billion minutes, from 16.0 billion minutes registered in the last quarter. On a similar trend, off-net mobile voice traffic increased to 2.3 billion from 2.2 billion minutes recorded during the previous quarter. On the contrary, mobile to fixed network voice traffic declined by 3.7% to 16.9 million minutes, from 17.6 million minutes recorded in the last quarter.
Data and broadband services
As of the end of 2020, more and more services had moved online, which has led to an increase in the consumption of data/internet. In addition, traffic growth has been fueled by more consumers viewing video content as a result of rising number of internet-enabled phones as well as availability of high speed internet in the country.
During the second quarter of FY 2020/21, the total data/Internet subscriptions amounted to 44.4 million subscriptions. These comprised 43.8 million wireless subscriptions and 572,982 fixed (wired) subscriptions.
Mobile broadband
During the period under review, the total broadband subscriptions rose by 4.6% to 25.8 million, from 24.6 million subscriptions registered in the last quarter. The number of 3G broadband subscriptions dropped by 2.2% to 14.3 million subscriptions. On the other hand, 4G broadband subscriptions grew by 15.3% in the referenced period, which is an indication of growing uptake of 4G technology in the country
The volume of mobile data consumed during the period grew to 165.8 million from 142.6 million GB used in the previous quarter as shown in the table below.
|
Indicator/Period |
Oct-Dec 20 |
Jul-Sep 20 |
Quarterly Variation (%) |
|
Total Broadband Subscriptions |
25,775,873 |
24,633,054 |
4.6 |
|
Total Mobile Broadband Subscriptions |
25,114,693 |
23,998,306 |
4.7 |
|
3G Broadband Subscriptions |
14,270,593 |
14,596,041 |
-2.2 |
|
4G Broadband Subscriptions |
10,844,100 |
9,402,265 |
15.3 |
|
Fixed Broadband Subscriptions |
661,180 |
634,748 |
4.2 |
|
Consumed Mobile Data Volumes (GB) |
165,783,102 |
142,640,432 |
16.2 |
Table 1 - Source: CA, Operators’ Returns
Mobile money services
The number of active registered mobile money subscriptions stood at 32.5 million, whereas the number of active mobile money agents stood at 264,390 during the period under review. The value of transfers across pay bill and till numbers grew significantly as shown in Table 2.
|
Indicator/Period |
Dec-20 |
Sep-20 |
Quarterly Variation (%) |
|
Agents |
264,390 |
245,124 |
7.9 |
|
Active Registered Mobile Money Subscriptions |
32,460,015 |
31,791,413 |
2.1 |
Table 2 - Source: CA, Operators’ Returns
The ICT sector has transformed and evolved immensely as a result of the global pandemic that began early this year. The outbreak resulted in increased demand and acquisition of telecommunication services and products by consumers. The pandemic has exposed market gaps and need for research areas that can be used to update the Kenya’s Digital Economy Blueprint in order to actualize a digitally transformed nation and to also ensure that there is growth in the digital economy. This can be achieved through government intervention and innovative partnerships aimed at improving the digital scope of the country, by assuring access, equity and affordability of telecommunication services to all.